Google Analytics Tips; How to Focus on Cities That Get Results
In this article I’m going to explain how you can see which geographic areas your searches are coming from and where to focus your efforts to increase visibility in these cities.
A little background
2012 was a rough year for anyone who was chasing keyword rankings as a primary measure of success. It was a rude awakening for many marketer’s when they found out that users are returned different organic results based on the city from which they are browsing. It was a bigger let down for almost everyone when Google searches performed by logged-in users began being encrypted and we all started seeing “Nor Provided” in Analytics instead of the keyword the searcher used to visit our site. While these changes were just a few that left internet marketer’s wondering about their future and grabbing another drink at the bar, the move forced our company to spend more time in Analytics.

We have all learned to hate the “Not Provided” term in Google Analytics!
Who was affected and how were they affected?
If you have a client that has office locations across an entire state or geographic region, you may have put too much effort on your previous keyword rankings. After all, a #1 ranking for “Car Accident Lawyer” in Dallas would mean it was the same in Austin, San Jose, New York, and everywhere else in that country, with the exception of the Google Business Profile results. However since that has changed with the Venice update, it’s time your thinking changes too. Even though we don’t have access to the keywords the searcher used we can easily dive into Google Analytics to see which areas are still preforming at their peak and which ones need a little more help.
A real world example
Recently a potential client approached us and informed us that they had locations all across California. While they had a banner month in sales two months prior, during the most recent months they had experienced a little bit of a drop and they didn’t know where to start. They informed me that they used to track keyword rankings, but since they were now geographically dependent they have not been successful in doing so.
We decided to dive into the analytics further by using the following method:
- Log into Google Analytics
- Select the date range of the first month that preformed well
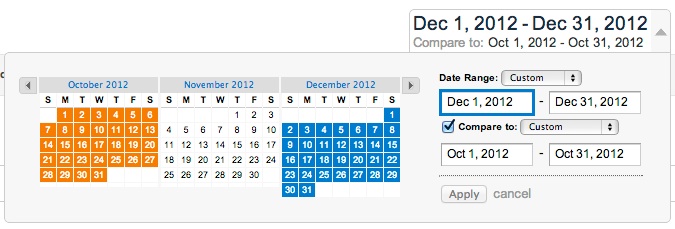
This is the date range we decided to use for the experiment
- Check the compare to checkbox and select a time period where the site did not preform as well
- Next, navigate to Audience > Demographics > Location
- Select the secondary dimension checkbox and type city. Select it once you have found it.
- In the search bar to the right of that, isolate the country you want to see (most people don’t want to start with Afghanistan)
- Sort the column by visits
- You’re done!
Analyze The Data!
As you can see in the example provided below, this particular client experienced a major drop in traffic between October (their best month) and December (a lower traffic month). This probably indicates that the keywords that they used to depend on in this area are probably not preforming the way they want them too.
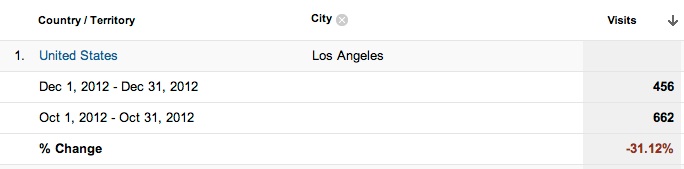
Whoa! Look at this data! They experienced a 31% Drop in traffic for Los Angeles. Who wants to bet that they had some ranking issues in that geographic area?
Actionable ways to use this data
If you have effective sales funnels, lead generation tracking and sales tracking, and you’re not doing eCommerce, it’s important to apply the analytics you collect to your actual conversions.
This client for example had a very effective internal system for tracking leads and sales through their phone system and collected customer information such as their city and the keywords they searched. This, along with their tracking phone numbers, allowed us to correlate the data and learn that the drop off’s they experienced were in the exact geo areas. But what if you didn’t have a good internal tracking system setup for this? Even though we won’t get the full picture with the “not provided” data, we can reach some reasonable assumptions by taking the following actions:
In Google Analytics make sure you still have the data ranges selected that we used above.
Navigate to Traffic Sources > Search > Organic
This will display a list of all of the keywords that sent traffic during the date ranges selected. While this information is very useful by itself, we can see what cities these searches came from. To do this, simply select the “Secondary Dimension” option and type the word city, and select the city option. Since doing this will create a lot of excess “not provided” results you can exclude them by clicking the advanced link. ![]()
It will bring up a screen link the one below where you can select the options:
Once you’re in the advanced section:
- Use the drop down and change it to exclude
- Select the green dimensions box and change it to Keyword
- Leave the drop down as “containing”
- Type not provided and select it from the list
- When you hit apply it will save the changes
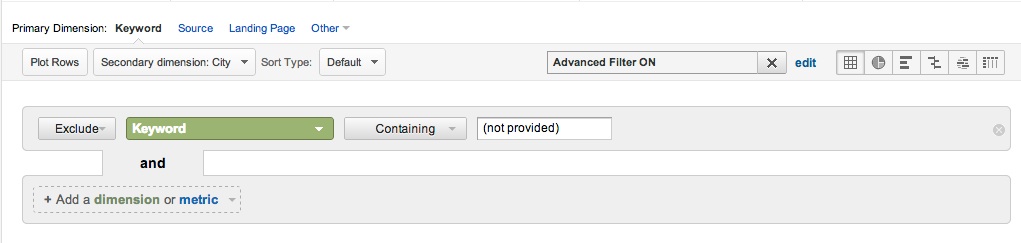
This image shows you how to exclude the annoying “not provided” keyword options from your Analytics view
Now you will have the view we want like it’s shown below with the “not provided” results excluded.
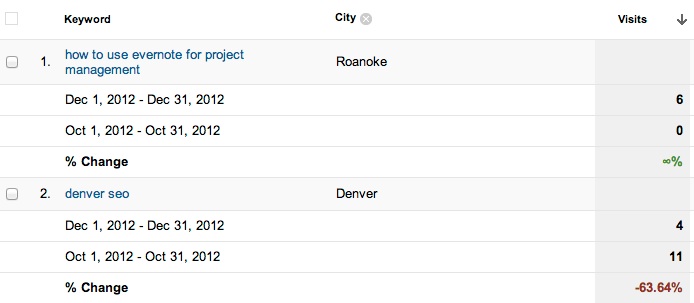
Results for our Denver SEO Keyword Showing what city the search originated from.
Although the keyword “Denver SEO” shows in the image below, the total search volume actually rose overall (It’s just not shown in this view). The snapshot above just shows that we had a significant drop in people searching within Denver that were adding the city name to their search result.
However, in another view where I used an advanced filter to only show the keyword “Denver SEO” you can see that there were more searches in multiple cities. Furthermore, keep in mind that the view I selected does not show the “not provided” results which could also add to these numbers (we will never know).
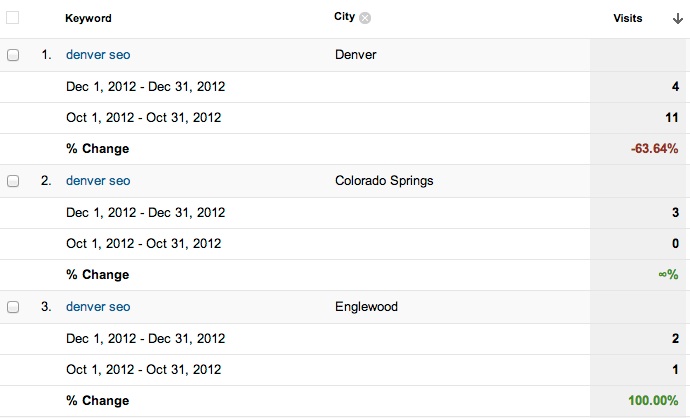
This is another view of our “Denver SEO” keyword. I changed the view to show that we had multiple searches for this keyword across different geographic areas. Keep in mind this does not show the “Not Provided” results.
Diving into your site’s analytics is an important job for any marketer or anyone who wants to truly understand the performance of their website. Using these simple tricks you can start to tear apart your data and develop an action plan for the keywords or geographic areas you want to focus on.